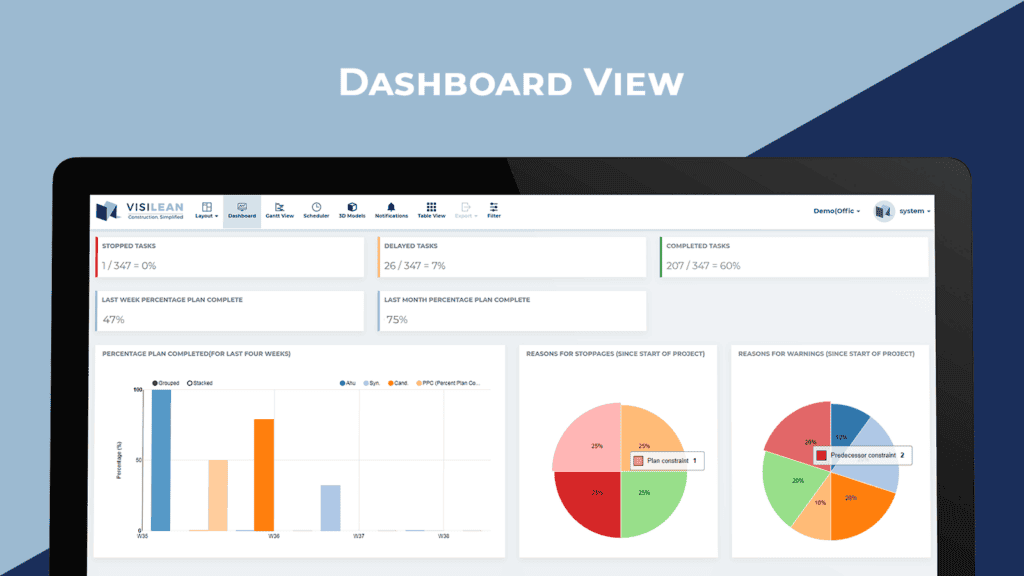
The newly designed Dashboard view provides a complete health check-up for your project as soon as you enter Visilean’s environment.
We have added key metrics and charts to a new default view. This gives you an overview of some important project indicators like tasks which are stopped, delayed, or completed. The often used percentage plan complete for last four weeks is shown for the whole project and also for individual subcontractors. The reasons for stoppages and warnings are shown through bar graphs and pie charts. The Dashboard is updated live and reflects the “pulse” of the project.


